EMA based ATR Stops-If the FAST EMA is ABOVE the SLOW EMA then the ATR Stops will be placed x amount BELOW the lows
-If the FAST EMA is BELOW the SLOW EMA , then the ATR Stops will be placed x amount ABOVE the highs
-If the fast ema is above the slow ema but they are sloping down, their colours will turn to a shade of blue
-If the fast ema is below the slow ema but they are sloping up, their colours will turn to a lighter shade of blue
-I added an extra ema but it is off by default
TAYOR!
Tìm kiếm tập lệnh với "3 ema"

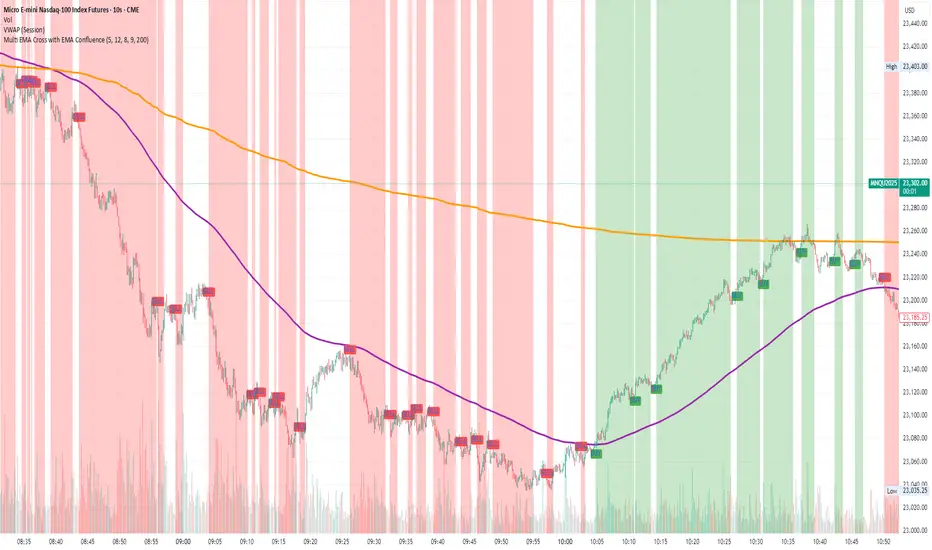
Multi EMA Cross with EMA ConfluenceMulti EMA Cross with EMA Confluence
This indicator combines the power of multiple EMA crossovers with a higher-timeframe confluence filter to help traders visualize potential bullish and bearish conditions on their charts.
Two groups of EMAs work together to establish alignment:
Group 1 (Fast / Slow Pair) – Shorter-term momentum shifts
Group 2 (Fast / Slow Pair) – Broader trend confirmation
On top of that, an optional Confluence EMA (default 200 EMA) acts as an additional filter, ensuring that signals align with the larger market trend.
Key features:
Customizable EMA lengths, colors, and confluence settings
Background highlighting when conditions align bullish or bearish
Clear buy/sell labels when new conditions trigger
Flexible enough to adapt across timeframes and trading styles
This tool is designed to enhance chart clarity and help you stay aligned with momentum and trend. It is not meant to replace your own analysis but rather to complement it.
Disclaimer: This script is for educational and informational purposes only. It is not financial advice. Trading involves risk, and you should always do your own research or consult with a licensed financial professional before making investment decisions.
CHN BUY SELL with EMA 200Overview
This indicator combines RSI 7 momentum signals with EMA 200 trend filtering to generate high-probability BUY and SELL entry points. It uses colored candles to highlight key market conditions and displays clear trading signals with built-in cooldown periods to prevent signal spam.
Key Features
Colored Candles: Visual momentum indicators based on RSI 7 levels
Trend Filtering: EMA 200 confirms overall market direction
Signal Cooldown: Prevents over-trading with adjustable waiting periods
Clean Interface: Simple BUY/SELL labels without clutter
How It Works
Candle Coloring System
Yellow Candles: Appear when RSI 7 ≥ 70 (overbought momentum)
Purple Candles: Appear when RSI 7 ≤ 30 (oversold momentum)
Normal Candles: All other market conditions
Trading Signals
BUY Signal: Triggered when closing price > EMA 200 AND yellow candle appears
SELL Signal: Triggered when closing price < EMA 200 AND purple candle appears
Signal Cooldown
After a BUY or SELL signal appears, the same signal type is suppressed for a specified number of candles (default: 5) to prevent excessive signals in ranging markets.
Settings
RSI 7 Length: Period for RSI calculation (default: 7)
RSI 7 Overbought: Threshold for yellow candles (default: 70)
RSI 7 Oversold: Threshold for purple candles (default: 30)
EMA Length: Period for trend filter (default: 200)
Signal Cooldown: Candles to wait between same signal type (default: 5)
How to Use
Apply the indicator to your chart
Look for yellow or purple colored candles
For LONG entries: Wait for yellow candle above EMA 200, then enter BUY when signal appears
For SHORT entries: Wait for purple candle below EMA 200, then enter SELL when signal appears
Use appropriate risk management and position sizing
Best Practices
Works best on timeframes M15 and higher
Suitable for Forex, Gold, Crypto, and Stock markets
Consider market volatility when setting stop-loss and take-profit levels
Use in conjunction with proper risk management strategies
Technical Details
Overlay: True (plots directly on price chart)
Calculation: Based on RSI momentum and EMA trend analysis
Signal Logic: Combines momentum exhaustion with trend direction
Visual Feedback: Colored candles provide immediate market condition awareness

EMA Oscillating Trend📈 EMA Oscillating Trend by AI-123
The EMA Oscillating Trend indicator is a dynamic trend visualizer that enhances traditional EMA behavior by offsetting the line based on trend direction, providing a more intuitive and visually distinct representation of market momentum.
🔍 Key Features:
🔵 Bullish Color Customization – Define your preferred color for bullish trends
🔴 Bearish Color Customization – Set a different tone for bearish phases
🪄 Adjustable Line Thickness – Tailor the EMA's appearance to your chart style
📐 Offset Multiplier Input – Automatically pushes the EMA above price in a downtrend and below price in an uptrend for enhanced clarity
⚙️ User-Friendly Inputs – No coding knowledge required; full customization in the settings panel
🧠 How It Works:
Calculates a primary EMA line (OV) and a sub-component to compare against (OV2)
Determines the trend based on whether OV is above or below OV2
Shifts the EMA line above price during bearish trends and below price during bullish trends
The offset is percentage-based and scales dynamically with the price for optimal readability
✅ Ideal For:
Trend-followers seeking visual clarity
Discretionary traders who want less clutter and more signal
Anyone who likes their EMAs with a little more flair and insight
🛠️ Author: @alphainvestor123
This tool was crafted with simplicity and clarity in mind. If you enjoy the indicator, consider dropping feedback or sharing your use case!

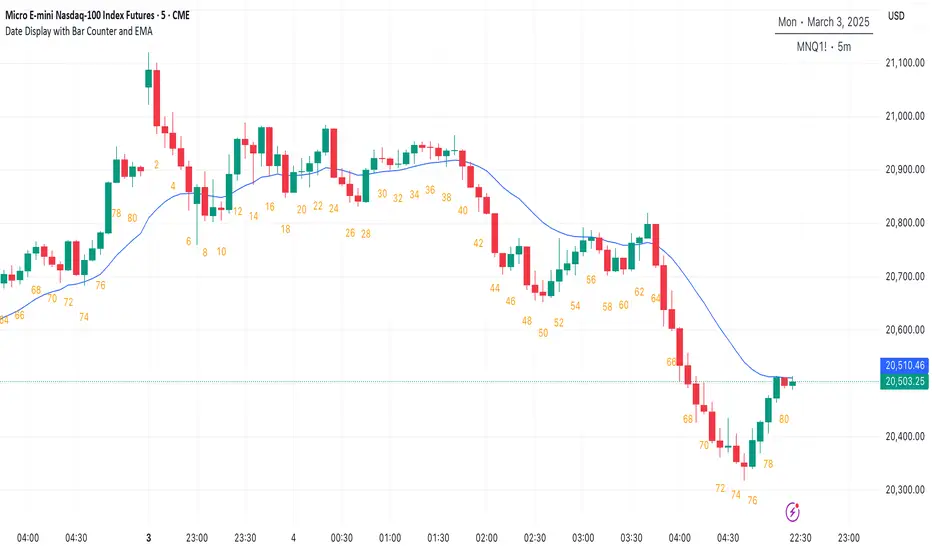
Date Display with Bar Counter and EMA===== ENGLISH DESCRIPTION =====
OVERVIEW:
This is a multi-function indicator that combines three useful tools in one script:
1. Date Display - Shows current date and symbol information in a customizable table
2. Bar Counter - Displays sequential bar numbers at specified intervals
3. EMA (Exponential Moving Average) - Plots an EMA line with customizable settings
FEATURES:
1. DATE DISPLAY:
- Shows date in full format (e.g., "Mon ∙ January 1, 2023") or short format (e.g., "Mon ∙ 01.01.23")
- Option to show/hide day of week
- Option to show/hide symbol and timeframe information
- Customizable table position (top/middle/bottom, left/center/right)
- Automatic color adjustment based on chart background
2. BAR COUNTER:
- Displays sequential bar numbers below price bars
- Customizable display frequency (every X bars)
- Special handling for Hong Kong futures (resets at market open)
- Different reset logic based on timeframe (daily, weekly, monthly)
- Customizable text size and color
3. EMA INDICATOR:
- Customizable period length (default: 20)
- Option to use different timeframe for calculation
- Option to wait for timeframe close for more stable signals
- Customizable line color
USAGE INSTRUCTIONS:
- After adding the indicator to your chart, customize settings in the "Format" panel
- The Date Display table will appear at your chosen position on the chart
- Bar numbers will appear below price bars at your specified frequency
- The EMA line will be plotted on the chart with your chosen settings
- Colors automatically adjust to light/dark chart themes
===== 中文说明 =====
概述:
这是一个多功能指标,将三个实用工具合并为一个脚本:
1. 日期显示 - 在可自定义的表格中显示当前日期和交易品种信息
2. K线计数器 - 按指定间隔显示K线序号
3. EMA指数移动平均线 - 绘制可自定义设置的EMA线
功能特点:
1. 日期显示:
- 支持完整格式(如"Mon ∙ January 1, 2023")或简短格式(如"Mon ∙ 01.01.23")
- 可选择显示/隐藏星期几
- 可选择显示/隐藏交易品种和时间周期信息
- 可自定义表格位置(顶部/中部/底部,左侧/中间/右侧)
- 根据图表背景自动调整颜色
2. K线计数器:
- 在价格K线下方显示序号
- 可自定义显示频率(每X根K线)
- 对香港期货有特殊处理(在开市时重置)
- 根据时间周期(日线、周线、月线)使用不同的重置逻辑
- 可自定义文字大小和颜色
3. EMA指标:
- 可自定义周期长度(默认:20)
- 可选择使用不同的时间周期进行计算
- 可选择等待时间周期结束以获得更稳定的信号
- 可自定义线条颜色
使用说明:
- 将指标添加到图表后,在"格式"面板中自定义设置
- 日期显示表格将出现在您选择的图表位置
- K线序号将按您指定的频率显示在价格K线下方
- EMA线将根据您选择的设置绘制在图表上
- 颜色会根据浅色/深色图表主题自动调整
*/
EMA Crossover Backtest [BarScripts]This indicator lets you backtest an EMA crossover strategy with built-in risk management and trade tracking. It simulates long and short trades based on EMA crossovers, allowing you to fine-tune entry conditions, stop-loss placement, and reward/risk settings.
🔹 How It Works:
Long Entry: Fast EMA crosses above Slow EMA, and price closes above Fast EMA.
Short Entry: Fast EMA crosses below Slow EMA, and price closes below Fast EMA.
Stop Loss: Set based on previous bars or a fixed amount.
Take Profit: Adjustable reward/risk ratio.
Higher Timeframe Confluence: Confirms trades based on a larger timeframe.
Trade Hours Filter: Limits trades to specific time windows.
🔹 Key Features:
✅ Shows Entry & Exit Points with visual trade lines.
✅ Customizable EMA Lengths to fit any strategy.
✅ P&L Tracking & Statistics to measure performance.
✅ Position Sizing Options: Fixed position, fixed risk, or percentage of balance.
✅ Commissions Tracking (based on total trades, not contracts).
Use this tool to fine-tune your EMA crossover strategy and see how it performs over time! 🚀
💬 Let me know your feedback—suggest improvements, report issues, or request new features!

Advanced EMA Cross with Normalized ATR Filter, Controlling ADX
Description:
This strategy is based on EMA cross strategy and additional filters are used to get better results, a normalized ATR filter, and ADX control...
It aims to provide traders with a code base that generates signals for long positions based on market conditions defined by various indicators.
How it Works:
1. EMA: Uses short (8 periods) and long (20 periods) EMAs to identify crossovers.
2. ATR: Uses a 14-period ATR, normalized to its 20-period historical range, to filter out noise.
3. ADX: Uses a 14-period RMA to identify strong trends.
4. Volume: Filters trades based on a 14-period SMA of volume.
5. Super Trend: Uses a Super Trend indicator to identify the market direction.
How to Use:
- Buy Signal: Generated when EMA short crosses above EMA long, and other conditions like ATR and market direction are met.
- Sell Signal: Generated based on EMA crossunder and high ADX value.
Originality and Usefulness:
This script combines EMA, ATR, ADX, and Super Trend indicators to filter out false signals and identify more reliable trading opportunities.
USD Strength in the code is not working, just simulated it as PSEUDO CODE:
Strategy Results:
- Account Size: $1000
- Commission: Not considered
- Slippage: Not considered
- Risk: Manageable through parameters, now less than 5% per trade
- Dataset: Aim for more than 100 trades for a sufficient sample size
- Test Conditions: Test in 30 min chart for BTCUSDT
IMPORTANT NOTE: This script should be used for educational purposes and should not be considered as financial advice.
Chart:
- The script's output is plotted as Buy and Sell signals on the chart.
- No other scripts are included for clarity.
- Have tested with 30mins period
- You are encouraged to play with parameters, let me know if it helps you and/or if you can upgrade the code to a better level.
WHY DID I USE ATR AND ADX?
ATR filter is usually used for the following purposes.
Market Volatility: ATR measures how volatile the market is. High ATR values indicate that the price is experiencing significant fluctuations.
Filtering: Crossing a certain ATR threshold may indicate that the market is active enough to present trading opportunities.
Risk Management: ATR can also be used to set stop-loss and take-profit levels, helping to manage risk effectively.
And ADX is usually used for;
Trend Strength: ADX measures the strength of a trend. High ADX values indicate a strong trend.
Filtering: An ADX value above a certain level suggests that the trend is strong and it might be safer to trade.
Versatility: ADX does not indicate the direction of the trend, only its strength. This makes it useful in both bullish and bearish markets.
Using these indicators together can help filter out false signals and produce more reliable trading signals. While ATR helps to determine if the market is active enough, ADX measures the strength of the trend. Combined, they can create a more complex and effective trading strategy.
I've used ADX data to support generating a buy signal after a golden cross (bullish trend) and waiting until this is a strong trend. It sounds good to check for different trend strengths for bullish and bearish markets to decide a buy signal. Additionally I used ATR to check if the market has enough fluctuations.

TradePro's 2 EMA + Stoch RSI + ATR StrategySaw TradePro's "NEW BEST HIGHEST PROFITING STRATEGY WITH CRAZY RESULTS - 2 EMA+ Stochastic RSI+ ATR", and was curious on the back testing results. This strategy is an attempt to recreate it.
This strategy uses 50 / 200 EMAs, Stochastic RSI and ATR.
Long Entry Criteria:
- 50 EMA > 200 EMA
- Price closes below 50 EMA
- Stochastic RSI has gone into oversold < 20
- Stochastic RSI crosses up while making higher low from previous cross up
Short Entry Criteria:
- 50 EMA < 200 EMA
- Price closes above 50 EMA
- Stochastic RSI has gone into overbought > 80
- Stochastic RSI crosses down while making lower high from previous cross down
Stop-loss is set to ATR stop-loss
Take Profit is 2x the risk
All parameters are configurable.
Enjoy~~

[francrypto® strategy] 4 EMAs, P.SAR & Vol.Prof. (by kv4coins)(ENG)
This script consists of my own strategy for cryptocurrency (but can be adapted very well for stocks, forex, etc.)
Is a combination of:
- Four Exponentials Moving Average (EMA), configurables: by defect are 10, 21, 55 and 200 periods in yellow, aqua, orange and blue each of them
- Parabolic SAR System (PSAR), configurable
- Volume Profile (that has been developed by kv4coins - he has already authorized me to use it under the same OSS Licence Terms: MPL 2.0), configurable: with another default values and bilingual support for Spanish (SPA)
How it works
1) It is always better to detect specifics candlesticks or patrons: doji , pinbar or inverted pinbar , engulfing bars , morning star or evening star , harami , twizzer bottom or top , etc.
2) The 10 and 21 periods EMA help to identify the short-term behavior
3) The 55 periods EMA can be used like a support or resistance in medium-term, as 200 periods EMA in very long-term
4) It will convenient search for a double cross (10 & 21) or a triple cross (10, 21 & 55) to determine the medium-term change Downtrend to UpTrend (or viceversa)
5) Confirm the change patron with the Parabolic SAR and then identify potencials purchases or sales
6) Use Volume profile to detect potential supports or resistances areas, in order to set stop limit/loss and take profit orders.
Hope this helps!
Cheers,
FRANCRYPTO®
–––––– 0 ––––––
(ESP)
Este script consiste en mi propia estrategia para criptomonedas (pero puede adaptarse muy bien para acciones, forex, etc.)
Es la combinación de:
1) Cuatro Medias Móviles Exponenciales (EMA), configurables: por defecto son de 10, 21, 55 y 200 períodos en amarillo, turquesa, naranja y azul cada una de ellas
2) Sistema Parabolic SAR (PSAR), configurable
3) Perfil de Volumen (que fuera desarrollado por kv4coins - que ya me ha autorizado a su uso bajo las mismas condiciones de la Licencia OSS: MPL 2.0), configurable: con otros valores por defecto y soporte bilingüe para Español (SPA)
Cómo funciona
1) Siempre va a resultar mejor detectar velas japonesas específicas o patrones: doji , martillos o martillos invertidos , velas envolventes , patrón amanecer o atardecer , harami , velas gemelas , etcétera
2) La EMA de 10 y 21 períodos ayudan a identificar el comportamiento de corto plazo
3) La EMA de 55 períodos puede ser usada como un soporte o resistencia de mediano plazo, como así también, la EMA de 200 períodos en el muy largo plazo
4) Será conveniente buscar un doble cruce (10 & 21) o un triple cruce (10, 21 & 55) para determinar un cambio de la tendencia de mediano plazo de bajista hacia alcista (o viceversa)
5) Confirmá el patrón de cambio con la Parabólica de SAR y entonces identificá potenciales compras o ventas
6) Usá el perfil de volumen para detectar las potenciales zonas de soporte o resistencia, principalmente para establecer ordenes stop limit/loss o take profit.
¡Espero que pueda serles de utilidad!
Saludos,
FRANCRYPTO®

Multiple EMAAn exponential moving average (EMA) is a type of moving average (MA) that places a greater weight and significance on the most recent data points. The exponential moving average is also referred to as the exponentially weighted moving average. An exponentially weighted moving average reacts more significantly to recent price changes than a simple moving average (SMA), which applies an equal weight to all observations in the period.
The EMA is a moving average that places a greater weight and significance on the most recent data points.
Like all moving averages, this technical indicator is used to produce buy and sell signals based on crossovers and divergences from the historical average.
Traders often use several different EMA lengths, such as 10-day, 50-day, and 200-day moving averages.
Points to remember:
Exponential moving averages are more sensitive to the recent price
EMA can signal good trades, but it can also keep you out of bad trades
EMA offers dynamic support and resistance levels, which is good for trailing Stop Loss
The EMA slope shape has hidden secrets
The rules for the EMA trading strategy can be modified to fit your own trading needs. We don’t claim this to be hard rules, but they are good on their own to make for a great trading strategy. Make sure you first test out the EMA strategy on a paper trading account before you risk any of your hard-earned money
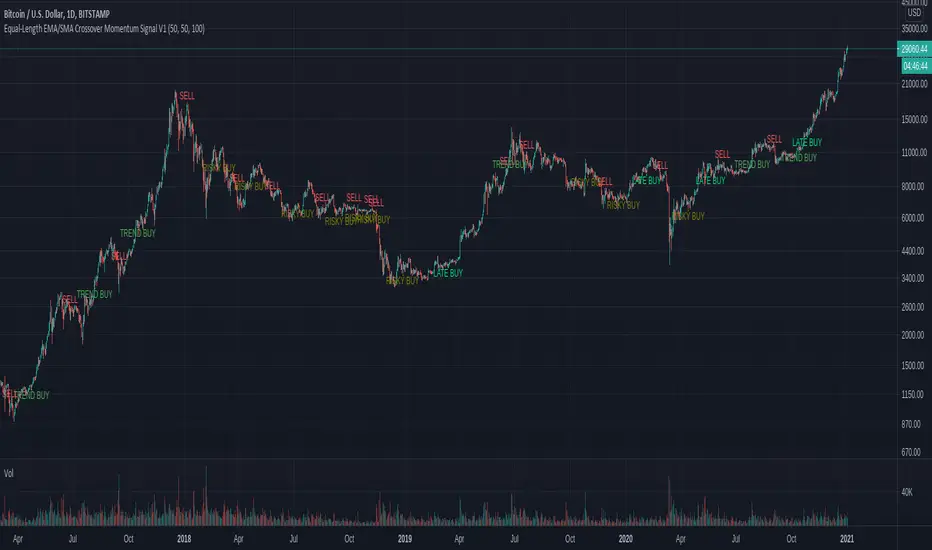
Equal-Length EMA/SMA Crossover Momentum Signal V1Overview:
This momentum and trend-following strategy captures the majority of any trending move, and works well on high timeframes.
It uses an equal-period EMA and SMA crossover to detect trend acceleration/deceleration, since an EMA places a greater weight and significance on the most recent data.
This version is optimized for longs, and designed to cut your losses quickly and let your winners run.
To reduce noise and optimize entries, we combined this with an overall trend bias for further confluence.
How it works:
Signals are determined by the crossover of an EMA and SMA of the same length, e.g. EMA-50 and SMA-50.
The overall trend bias is determined using a slower SMA golden/death cross, e.g. SMA-50 and SMA-100.
The signal is stronger when it occurs in confluence with the overall trend bias, e.g. when EMA-50 crosses over SMA-50, while above the SMA-100. This is analogous to only opening long positions in a bull market.
Signal description:
Trend Buy: EMA crosses above SMA, and overall trend bias is bullish. Buying is in confluence with the overall trend bias.
Risky Buy: EMA crosses above SMA, and overall trend bias is bearish. Buying is early, more risky, and not in confluence with the overall trend bias.
Late Buy: SMA crosses above BIAS_SLOW. This gives further confirmation of bullish trend, but signal comes later.
Sell: EMA crosses under SMA.
EMA Crossover StrategyEMA Crossover Strategy
This strategy will enter a long trade when the 21 EMA crosses over the 55 EMA and both EMAs and the close price are above the 200 EMA (long-term trend).
It will enter a short trade when the 21 EMA crosses under the 55 EMA and both EMAs and the close price are below the 200 EMA.
It will exit a long trade when the RSI crosses under from overbought and indicates that the uptrend could be coming to an end.
It will exit a short trade when the RSI crosses over from oversold and indicates that the downtrend could be coming to an end.
Backtesting shows that it works best on:
30 MIN:
SYMBOL - PROFIT FACTOR
AUDCAD - 1.126
EURJPY - 1.12
EURNZD - 1.04
EURUSD - 1.65
GBPAUD - 1.27
USDCAD - 1.08
1 HR:
SYMBOL - PROFIT FACTOR
CADJPY- 1.23
EURNZD- 1.166
GBPJPY- 1.23
GBPUSD- 1.282
NZDJPY- 1.246
USDCHF- 1.344
3 HR:
SYMBOL - PROFIT FACTOR
CADCHF- 1.975
EURGBP- 1.776
EURNZD- 1.911
GBPAUD- 1.364
GBPCHF- 1.311
USDJPY- 1.162
XAUUSD - 2.00
As always, this strategy does not guarantee you to achieve profits and you should always use confirmations before entering a trade.

[New series!] [Consistent Losing Strategies] 34 EMA Scalping//---------------------------INTRO------------------------------
Hi All!
Let me introduce myself as a semi-successful forex trader & lover of automation.
I've taken to algo trading and have been hunting down strategies (that usually use indicators) to automate, backtest, and hopefully implement in MT4.
Unfortunately, most strategies are complete bulls*** and the select cases that are shown to "prove" success are limited.
These strategy sources often do not provide useful analytics either.
I want to change that approach to trading! We can really benefit each other and the community by being methodical about backtesting
as well as evaluating our results with some kind of scoring heuristic.
As for what that standardized process looks like..well I'm still working on it.
I'm pretty much on Tv for multiple hours of the day, screening strategies via Pinescript and I'd like to start sharing my progress!
This is a new series I'd like to start on consistently losing strategies. I'll make all the code public, so if you think I've made a blunder
or approached a problem the wrong way, then drop me a DM or paste your fix into the comments.
//---------------------------STRAT------------------------------
34 EMA Scalping strategy (ref. forextradingstrategies4u )
How you're supposed to trade it:
BUY:
1. Market is in an down trend as shown by the 34 EMA
2. Price breaks above a downwards trend line
3. Price breaks above the 34 EMA
4. Look for a very bullish candlestick or chart pattern
SELL:
1. Look for the 34 EMA to show we are in an uptrend
2. Price breaks below an upwards sloping trend line
3. Price breaks below 34 EMA
4. Look for a bearish candlestick or a chart pattern
//---------------------------CONC------------------------------
Q: Why does it fail?
A: I believe this strategy relies too much on subjective input (aka, trendlines).
Q: Why does it fail as an algo?
A: The 34 EMA is no more predictive than any other EMA, although it does a good job at filtering out noise.
Q: Should I try it out?
A: No, it's trash. This is the proof that it is trash.

EMA Cloud + AlertsThe only EMA indicator you'll ever need.
- Flexible EMAs: Customize EMA lengths (e.g., 9, 21) to match your trading style.
- Dynamic Cloud: Auto-shades bullish (green) or bearish (red) clouds between EMAs for clear trend signals.
- Trend Change Alerts: Auto-alerts that signal when a trend change (EMA crossover) happens on the timeframe you're currently viewing.
- Timeframe Lock: Lock EMAs to a specific timeframe (e.g., 5m on a 1m chart) for consistent analysis.
- Personalized Design: Adjust EMA colors, thickness, and cloud transparency for optimal visibility.
A friendly reminder that no tool or indicator guarantees success. Integrate this into a robust trading plan.

Custom MTF EMA CloudsVisualize market structure and trend alignment across multiple timeframes with six layered EMA clouds — from short-term momentum to macro trend anchors.
Each pair of EMAs forms a dynamic cloud that adapts to your selected timeframe.
Colors, lengths, and visibility are fully customizable, allowing you to tailor the setup for any trading style.
⚙️ Default Configuration
EMA Short Long Purpose
1 8 13 🔸 Intraday momentum cloud (scalping layer)
2 21 24 🟩 Short-term trend confirmation
3 50 55 🔵 Medium-term swing structure
4 120 144 🔴 Long-term support/resistance band
5 200 238 🟠 Institutional trend foundation
6 400 460 🟣 Macro directional anchor
🧩 Features
✅ Up to 6 independent EMA clouds
✅ Fully customizable short & long lengths
✅ Individual line and cloud colors
✅ Toggle each layer on/off
✅ Works with any timeframe via the Resolution input
✅ Automatic cloud transparency for better chart clarity
📈 How to Use
Use EMA 1–2 (8/13, 21/24) for momentum shifts and intraday entries.
Use EMA 3–4 (50/55, 120/144) for swing confirmation and trend continuation.
Use EMA 5–6 (200/238, 400/460) as long-term anchors to stay aligned with institutional flow.
Watch for crossovers or price breaking in/out of clouds — they often precede strong directional moves.

Turtle Strategy - Triple EMA Trend with ADX and ATRDescription
The Triple EMA Trend strategy is a directional momentum system built on the alignment of three exponential moving averages and a strong ADX confirmation filter. It is designed to capture established trends while maintaining disciplined risk management through ATR-based stops and targets.
Core Logic
The system activates only under high-trend conditions, defined by the Average Directional Index (ADX) exceeding a configurable threshold (default: 43).
A bullish setup occurs when the short-term EMA is above the mid-term EMA, which in turn is above the long-term EMA, and price trades above the fastest EMA.
A bearish setup is the mirror condition.
Execution Rules
Entry:
• Long when ADX confirms trend strength and EMA alignment is bullish.
• Short when ADX confirms trend strength and EMA alignment is bearish.
Exit:
• Stop Loss: 1.8 × ATR below (for longs) or above (for shorts) the entry price.
• Take Profit: 3.3 × ATR in the direction of the trade.
Both parameters are configurable.
Additional Features
• Start/end date inputs for controlled backtesting.
• Selective activation of long or short trades.
• Built-in commission and position sizing (percent of equity).
• Full visual representation of EMAs, ADX, stop-loss, and target levels.
This strategy emphasizes clean trend participation, strict entry qualification, and consistent reward-to-risk structure. Ideal for swing or medium-term testing across trending assets.

Dual EMA (EMA Average)Simple EMA visual with 2 EMAs + Average
Includes:
2 EMAs with timeframe settings
EMA Midline - an average of EMAs
shaded space between EMA lines

[LeonidasCrypto]EMA with Volatility GlowEMA Volatility Glow - Advanced Moving Average with Dynamic Volatility Visualization
Overview
The EMA Volatility Glow indicator combines dual exponential moving averages with a sophisticated volatility measurement system, enhanced by dynamic visual effects that respond to real-time market conditions.
Technical Components
Volatility Calculation Engine
BB Volatility Curve: Utilizes Bollinger Band width normalized through RSI smoothing
Multi-stage Noise Filtering: 3-layer exponential smoothing algorithm reduces market noise
Rate of Change Analysis: Dual-timeframe RoC calculation (14/11 periods) processed through weighted moving average
Dynamic Normalization: 100-period lookback for relative volatility assessment
Moving Average System
Primary EMA: Default 55-period exponential moving average with volatility-responsive coloring
Secondary EMA: Default 100-period exponential moving average for trend confirmation
Trend Analysis: Real-time bullish/bearish determination based on EMA crossover dynamics
Visual Enhancement Framework
Gradient Band System: Multi-layer volatility bands using Fibonacci ratios (0.236, 0.382, 0.618)
Dynamic Color Mapping: Five-tier color system reflecting volatility intensity levels
Configurable Glow Effects: Customizable transparency and intensity settings
Trend Fill Visualization: Directional bias indication between moving averages
Key Features
Volatility States:
Ultra-Low: Minimal market movement periods
Low: Reduced volatility environments
Medium: Normal market conditions
High: Increased volatility phases
Extreme: Exceptional market stress periods
Customization Options:
Adjustable EMA periods
Configurable glow intensity (1-10 levels)
Variable transparency controls
Toggleable visual components
Customizable gradient band width
Technical Calculations:
ATR-based gradient bands with noise filtering
ChartPrime-inspired multi-layer fill system
Real-time volatility curve computation
Smooth color gradient transitions
Applications
Trend Identification: Dual EMA system for directional bias assessment
Volatility Analysis: Real-time market stress evaluation
Risk Management: Visual volatility cues for position sizing decisions
Market Timing: Enhanced visual feedback for entry/exit consideration

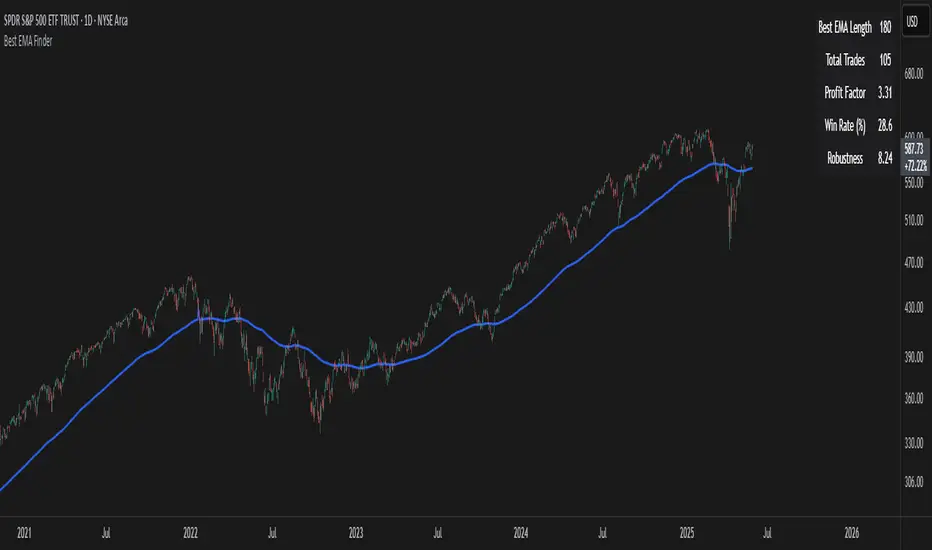
Best EMA FinderThis script, Best EMA Finder, is based on the same original logic as the Best SMA Finder I published previously. Although it was not the initial goal of the project, several users asked for an EMA version, so here it is.
The script scans a wide range of Exponential Moving Average (EMA) lengths, from 10 to 500, and identifies the one that historically delivered the most robust performance on the current chart. The choice to stop at 500 is deliberate: beyond that point, EMA curves tend to flatten and converge, adding processing time without meaningful differences in signals or outcomes.
Each EMA is evaluated using a custom robustness score:
Profit Factor × log(Number of Trades) × sqrt(Win Rate)
Only EMA lengths that exceed a user-defined minimum number of trades are considered valid. Among these, the one with the highest robustness score is selected and displayed on the chart.
A table summarizes the results:
- Best EMA length
- Total number of trades
- Profit Factor
- Win Rate
- Robustness Score
You can adjust:
- Strategy type: Long Only or Buy & Sell
- Minimum number of trades required
- Table visibility
This script is designed for analysis and optimization only. It does not execute trades or handle position sizing. Only one open trade per direction is considered at a time.
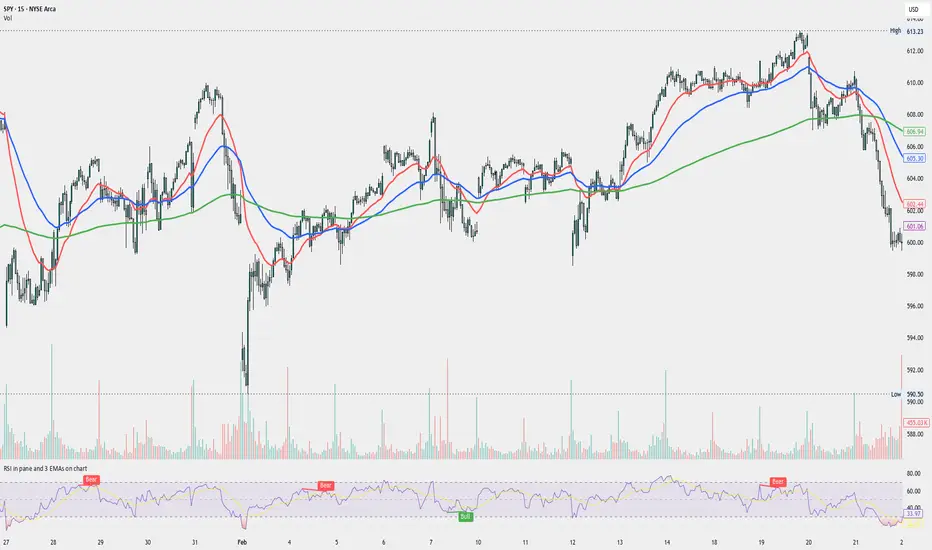
RSI in pane and 3 EMAs on chartCustom RSI in Pane + 3 EMAs on Chart — with Optional RSI Divergence Detection
Combines RSI in a separate pane with 3 EMAs on the chart and optional RSI-based divergence detection. Useful for analyzing both momentum and trend structure.
Features
RSI Pane
Custom RSI calculation (not built-in ta.rsi) with adjustable source and length
Overlay optional moving average (SMA, EMA, SMMA/RMA, WMA, VWMA, or Bollinger Bands) Overbought/oversold gradient fill for visual clarity (70 / 30 zones)
Midline (50) for neutral RSI territory
RSI Divergence Detection
Optional: toggle on/off with one input
Regular Bullish Divergence : Price makes a lower low, RSI makes a higher low
Regular Bearish Divergence : Price makes a higher high, RSI makes a lower high
Customizable lookback for pivot detection
Visual markers and labels plotted on RSI
Built-in alert conditions for both divergence types
3 EMA Trend Indicators on Price Chart
Three customizable EMAs (default: 20, 50, 200)
Color-coded and clearly plotted on main chart
Use to determine short/mid/long-term trend bias
No repainting or smoothing artifacts
Why use this script?
Gives a full view of trend + momentum without cluttering the main price chart, and it helps confirm entries and exits by observing RSI behavior alongside EMAs. The optional divergence detection can act as a signal for potential exhaustion or reversal (not entry signals on their own). It is a Good fit for traders who use RSI zones, divergences, and EMA structure in their decision-making, both for intra-day and swing trades (where it performs best).
How to use
Add this script to your chart. EMAs will appear on the main price chart; RSI and divergence will appear in a separate pane.
Adjust RSI and MA settings to fit your trading style (e.g., fast RSI for scalping, slower for swing)
Enable "Show Divergence" if you want visual alerts and markers
Use alerts to get notified when a divergence occurs without watching the chart
Always check the divergences on different time frames to validate the setup, and do not consider them valid on small time frames (<15 minutes).
Built for traders who want both momentum and trend context in a single tool — without clutter, repainting, or noise. I created this script to streamline my own analysis and avoid switching between multiple indicators. It's not meant to be a "signal generator" but a visual assistant for making better decisions. If you find it useful or have feedback, feel free to reach out.
TradZoo - EMA Crossover IndicatorDescription:
This EMA Crossover Trading Strategy is designed to provide precise Buy and Sell signals with confirmation, defined targets, and stop-loss levels, ensuring strong risk management. Additionally, a 30-candle gap rule is implemented to avoid frequent signals and enhance trade accuracy.
📌 Strategy Logic
✅ Exponential Moving Averages (EMAs):
Uses EMA 50 & EMA 200 for trend direction.
Buy signals occur when price action confirms EMA crossovers.
✅ Entry Confirmation:
Buy Signal: Occurs when either the current or previous candle touches the 200 EMA, and the next candle closes above the previous candle’s close.
Sell Signal: Occurs when either the current or previous candle touches the 200 EMA, and the next candle closes below the previous candle’s close.
✅ 30-Candle Gap Rule:
Prevents frequent entries by ensuring at least 30 candles pass before the next trade.
Improves signal quality and prevents excessive trading.
🎯 Target & Stop-Loss Calculation
✅ Buy Position:
Target: 2X the difference between the last candle’s close and the lowest low of the last 2 candles.
Stop Loss: The lowest low of the last 2 candles.
✅ Sell Position:
Target: 2X the difference between the last candle’s close and the highest high of the last 2 candles.
Stop Loss: The highest high of the last 2 candles.
📊 Visual Features
✅ Buy & Sell Signals:
Green Upward Arrow → Buy Signal
Red Downward Arrow → Sell Signal
✅ Target Levels:
Green Dotted Line: Buy Target
Red Dotted Line: Sell Target
✅ Stop Loss Levels:
Dark Red Solid Line: Stop Loss for Buy/Sell
💡 How to Use
🔹 Ideal for trend-following traders using EMAs.
🔹 Works best in volatile & trending markets (avoid sideways ranges).
🔹 Can be combined with RSI, MACD, or price action levels for added confluence.
🔹 Recommended timeframes: 1M, 5M, 15m, 1H, 4H, Daily (for best results).
🚀 Try this strategy and enhance your trading decisions with structured risk management!

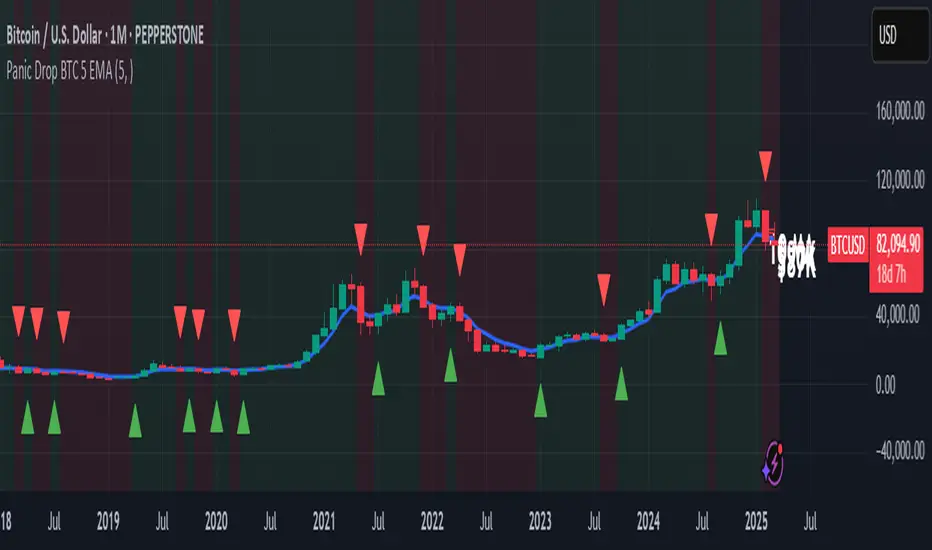
Panic Drop Bitcoin 5 EMA Buy & Sell SignalPanic Drop BTC 5 EMA
What It Does:
This indicator tracks Bitcoin’s price against a 5-period Exponential Moving Average (EMA) to deliver simple buy and sell signals. A green arrow below the candle signals a buy when Bitcoin closes above the 5-EMA, while a red arrow above signals a sell when it closes below. Perfect for spotting Bitcoin’s momentum shifts—whether you’re a newbie, crypto trader, or short on time.
Key Features:
Plots a customizable 5-EMA (default: blue line).
Buy () and Sell () signals on crossovers/crossunders.
Optional background highlight: green (above EMA), red (below).
Alerts for buy/sell triggers.
Fully adjustable: timeframe, colors, signal toggles.
How to Use It:
Add to your BTC/USD chart (works on any timeframe—daily default recommended).
Watch for green arrows (buy) below candles and red arrows (sell) above.
Customize via settings:
Adjust EMA period (default: 5).
Set timeframe (e.g., "D" for daily, "1H" for hourly).
Change colors or toggle signals/background off.
Set alerts: Right-click a signal > "Add Alert" > Select "Buy Signal" or "Sell Signal."
Trade smart: Use signals to catch Bitcoin dips (e.g., buy below $100K) or exits.
Why It’s Great:
Beginners: Clear arrows simplify decisions.
Crypto Traders: 5-EMA catches Bitcoin’s fast moves.
Busy Investors: Signals save time—no deep analysis needed.
Created by Timothy Assi (Panic Drop), eToro’s elite investor. Test it, tweak it, and trade with confidence!
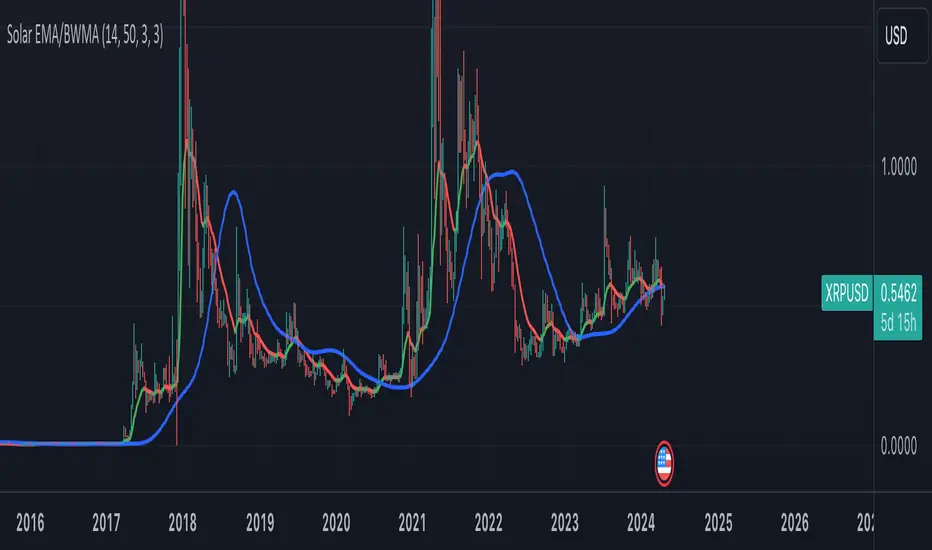
Combined Indicator: Solar EMA and BWMACombined Indicator: Solar EMA and BWMA
This custom indicator combines two popular moving average techniques, the Exponential Moving Average (EMA) and the Barycenter Weighted Moving Average (BWMA), to provide insights into market trends and potential trade opportunities.
Solar EMA (Exponential Moving Average):
The Solar EMA is a dynamic moving average that reacts quickly to price changes while reducing lag.
It is plotted on the chart with customizable lengths, allowing traders to adapt to different market conditions.
Bullish (upward) trends are indicated by a green line, bearish (downward) trends by a red line, and neutral periods by a yellow line.
BWMA (Barycenter Weighted Moving Average):
The BWMA is a weighted moving average that emphasizes recent price action while maintaining smoothness.
It is calculated using a combination of alpha and beta parameters, providing flexibility in tuning to specific market behaviors.
The BWMA line is plotted on the chart, with color indicating trend direction: blue for bullish, red for bearish, and gray for neutral.
Key Features:
Dynamic adaptation to different timeframes, adjusting lengths for both EMA and BWMA based on the selected timeframe.
Detection of potential trend changes and significant market movements using a combination of EMA trend analysis and RSI (Relative Strength Index).
Buy and sell signals generated based on support and resistance levels, providing actionable insights for traders.
Usage:
Traders can use the Solar EMA and BWMA to identify trends, confirm trend reversals, and plan entry and exit points for trades.
Combining both moving averages offers a comprehensive view of market sentiment and enhances decision-making processes.
Disclaimer:
This indicator is intended for educational and informational purposes only and should not be construed as financial advice. Traders are encouraged to conduct their own research and analysis before making any trading decisions.